If you are just arriving, please check out part 1 first!
Last time we covered GPS logger apps and the data which is stored from the apps. This time we will cover how to apply this data into something that is useful to us when debriefing a flight or just keeping track of where we have flown. As mentioned last time, the data is not as reliable for elevation as it is for the latitude and longitude.
These instructions can be carried out on a computer or straight from your cell phone. The data file is nothing more than a glorified text file so it does not take much data to transfer the file to the internet. The biggest use of data if using your cell phone will be opening the pictures it produces.
USING YOUR COMPUTER
The first thing we must do is locate and transfer the file to your computer. There are a few ways of doing this. If you are comfortable using the file system on your phone, you can access the file itself on the phone. First (if you are using GPS Logger … it may be different for other apps), open the app, find the track, tap on it and choose “export”. Our logger creates a folder in your phone with the name of the app “GPS Logger” and the .gpx file is inside this folder. From here you can transfer the file to your computer.
If you are not comfortable with the file system on your phone, simply click on the track and select “share” and email it to yourself. By doing this the app will save two files. The first file is a .gpx file which is what we covered in the first part. The second should be a .kml file type which we will use later.
USING YOUR PHONE
If you are using your phone to upload the files to the plotters, then all you really need to know is where the files are on your phone. First (if you are using GPS Logger … it may be different for other apps), open the app, find the track, tap on it and choose “export”. Our logger creates a folder in your phone with the name of the app “GPS Logger” and the .gpx file is inside this folder. This is where you will get the file from once connected to the web based plotter.
GETTING YOUR PLOT ON
Now that we have our files we are ready to plot. There are many resources online to allow us to visualize this data. We will cover a few of them here however, don’t be afraid to try others. Each of them have different interfaces and amenities but most of them work about the same as far as getting your data and outputting the data as a graph or image.
We have chosen the following to work with just to give us a variety of readouts…
GPS Visualizer
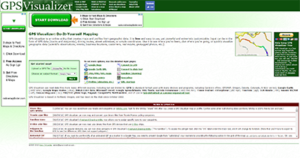
GPS Visualizer – GPS Visualizer is an online utility that creates maps and profiles from geographic data. It is free and easy to use, yet powerful and extremely customizable. Input can be in the form of GPS data (tracks and waypoints), driving routes, street addresses, or simple coordinates. Use it to see where you’ve been, plan where you’re going, or quickly visualize geographic data (scientific observations, events, business locations, customers, real estate, geotagged photos, etc.). [Description taken from their site]
Offers the following data visualization types:
- Google Maps
- Google Earth
- JPEG/PNG/SVG maps
- Plot data points
- Profiles (elevation)
The way you use GPS Visualizer is simple. Navigate to the page, find the “Get Started now!” box, select “Choose File” and find your .gpx file. Then select in the output format dropdown box the type of data output you would like. That is it! It will open a new page and display your data.
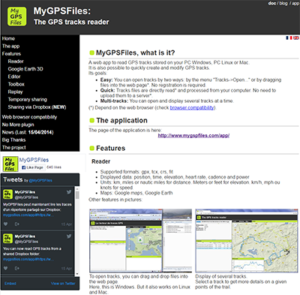
MyGPSFiles
MyGPSFiles – Offers drag and drop for your .gpx files (as well as others).
To use MyGPSFiles, use this link which will take you straight to the GPS Tracks Reader page. On this page you can simply drag and drop your .gpx file onto the map and on the top select the type of map to use. If you choose Google maps you may need to install the plugin. If the plugin is needed, you will receive an error that looks like the following. To fix, simply click the “here” link and install the plugin.
Error:
More information here
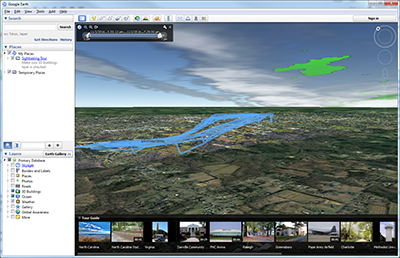
Google Earth (must download and install) – Google will allow you to plot the elevations on Google maps to get a more “realistic” view of your track. This will have to be installed on your computer however, as with all of this software, it is free.
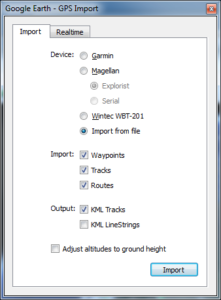
In order to use Google Earth, you must first install it from here. Once installed, open and go to Tools -> GPS. Choose the setting as below. Make sure you select “Import from file” AND uncheck “Adjust altitudes to ground height”.
Google Earth
Navigating in Google Earth can be a bit challenging. Use your right & left mouse buttons as well as the mouse wheel if you have one. One really neat feature of Google Earth is the slider at the top of the data maps. If you move the slider back and forth, you erase or draw the data based on the timeline. So in the case of my data which was pattern work, I can see each rotation around the pattern being drawn, in order that I flew them.
I hope this help you with your flying! If you have any questions please shoot me off an email or comment below. Thanks for your time and stay safe!